Description
Lectures / Workshops
In the SC Design 10 week course each week a key topic is theoretically outlined in a ‘lecture/workshop’ , such as:
‘Social Cohesion’, ‘Scenario writing’, ‘Q Methodology’, ‘Look & Feel’ and so on. The lectures aim at providing a basical theoretical knowledge for the students, necessary to conduct the assignment , while at the same time stimulating group discussion and project involvement.
Presence at the lecture/workshops is obligatory.
Week 1
Social Cohesion / Theory outline
For further study material for Social Cohesion theory see References under.
Many definitions have been formulated for the concept of Social Cohesion. They all are vague and hardly operational for designers. What does it mean for instance that Social Cohesion is defined as the’glue’ that holds members of a society together? In this course an attempt is made to apply ‘Q methodology’ (see under) as a tool to help identify concrete aspects of social cohesion, to be improved, as perceived by community members. The so-called ‘Q-concourse’ (see under) is based on social cohesion theory. Typically sociologists recognise three main dimensions within the concept of Social Cohesion: Sense of Belonging, Face to Face contacts (sharing of the same physical space), and Social Capital formulated as an economic aspect of Social Cohesion.
Sense of Belonging
Belonging includes the person’s fit with his/her environments and also has three sub-domains. Physical Belonging is defined as the connections the person has with his/her physical environments such as home, workplace, neighbourhood, school and community. Social Belonging includes links with social environments and includes the sense of acceptance by intimate others, family, friends, co-workers, and neighbourhood and community. Community Belonging represents access to resources normally available to community members, such as adequate income, health and social services, employment, educational and recreational programs, and community activities.
Face to Face
Researchers at McGill University found that it takes less than a day of no normal contact with the outside world for an adult to start hallucinating.
Even when it’s not such drastic circumstances, talking to a live person can give us a surge of energy in the middle of the workday. “In-person contact stimulates an emotional reaction,” says Lawrence Honig, a neurologist at Columbia University. Bonding hormones are higher when people are face-to-face. And some scientists think that face-to-face contact stimulates the attention and pleasure neurotransmitter dopamine, and serotonin, a neurotransmitter that reduces fear and worry.
Social Capital
Social capital is a sociological concept used in business, economics, organizational behaviour, political science, public health and the social sciences in general to refer to connections within and between social networks. Though there are a variety of related definitions, which have been described as “something of a cure-all” for the problems of modern society, they tend to share the core idea “that social networks have value. Just as a screwdriver (physical capital) or a college education (human capital) can increase productivity (both individual and collective), so do social contacts affect the productivity of individuals and groups”.
Breakdown of Social Cohesion concept into specific statements.
Based on these 3 dimensions of the Social Cohesion Concept (Face to Face , Sense of Belonging, Social Capital) 23 statements have been selected covering the topic of Social Cohesion. These specific statements can be used to develop a specific Social Cohesion Design Mission applying the Q Methodology (see).
Example of a Social Cohesion breakdown into specific statements.
Sample is taken from the Douwe Egberts Coffee case 2011 (see case 2011).
I find it pleasant that I can drop in at a colleagues office without making an appointment first.I know my colleagues pretty well.I like to tell about my work at home or to friends. They know quite well what my work is about.I would like to know more about the personal interests of my colleages. What kind of hobbies they have.I do not have a clear picture of how my work fits in the overall vision and mission of the organisation.I feel there should be more informal events at my department to get to know each other both on a professional andpersonal level.When my colleague has been absent for more than 1 day I ask around the administartion what’s going on.When I am sick I find it pleasant when colleagues call me and ask me how I am doing.When I receive a lot of feedback on my work and from colleagues it makes me feel important and valued.Personal, face to face contact is crucial for my wellbeing. There are not enough ‘human moments’ in my opinion.I think that we can work much more efficient when we have more contact on a personal level.I would like to be more involved in the overall policy making.I prefer E-mail contact to face to face contact because it is time saving and to me time is very precious.I have more social contacts at work then in my private life.I see myself first of all as a professional who does his job, and only secondly as a member of the organisation.I prefer working at home because I feel less controlled by others.I feel very much at ease at work. It’s a cosy place and i regard my colleagues as my friends.It’s very easy to take initiatives with others to start new projects. It does not take a lot of preparation and paperwork.I feel I am treated very much equal to the others.I don’t sense a considerable hierarchy within the institute.In my office I feel a bit like a prisoner locked up in his cell from 9-5. I had rather work in an open space withothers and be more free to determine my hours.My department is quite isolated from the others. I have hardly any idea what is going on at theother departments.I feel like the institute is a big ‘family’ and I find a lot of solidarity among my colleagues. When I haveproblems, also personal, I can discuss them with my colleagues.I feel free to invite my family to my workplace and introduce them to my colleagues.
References
Sclove Richard E ,1995, Democracy and technology
New York : Guilford Press
Friedkin Noah E. – Social Cohesion
Department of Sociology, 2000, University of California, Santa Barbara,
California 93106;
Putnam Robert – Bowlin’ Alone / The collapse and revival of American community
New York, Simon & Schuster 2000
Reeskens Tim , Botterman Sarah & Hooghe Marc, 2000,– Is Social Cohesion one latent concept?
Investigating the dimensionality of social cohesion on the basis of the
Kearns and Forrest typology. Center for Political Research, KULeuven
Motivation Theory / Guest Lecture

The “Individual Umbrella”.


The “Social Umbrella”.
Motivation is the driving force by which humans achieve their goals. Motivation is said to be intrinsic or extrinsic.The term is generally used for humans but it can also be used to describe the causes for animal behavior as well. This article refers to human motivation. According to various theories, motivation may be rooted in a basic need to minimize physical pain and maximize pleasure, or it may include specific needs such as eating and resting, or a desired object, goal, state of being, ideal, or it may be attributed to less-apparent reasons such as altruism, selfishness, morality, or avoiding mortality. Conceptually, motivation should not be confused with either volition or optimism.Motivation is related to, but distinct from, emotion.
A reward, tangible or intangible, is presented after the occurrence of an action (i.e. behavior) with the intent to cause the behavior to occur again. This is done by associating positive meaning to the behavior. Studies show that if the person receives the reward immediately, the effect is greater, and decreases as duration lengthens. Repetitive action-reward combination can cause the action to become habit. Motivation comes from two sources: oneself, and other people. These two sources are called intrinsic motivation and extrinsic motivation, respectively.
References
Cofer, Charles N; Appley, Mortimer H ,1967, Motivation: Theory and Research, New York, London, Sydney: John Wiley & Sons
Fishbein, M.; Ajzen, I. 1975, Belief, attitude, intention, and behavior: An introduction to theory and research, Reading, MA: Addison-Wesley
Week 2
Q Factor Analysis
Q methodology provides a foundation for the systematic study of subjectivity, a person’s viewpoint, opinion, beliefs, attitude, and the like (Brown 1993). Typically, in a Q methodological study people are presented with a sample of statements about some topic, called the Q-set. Respondents, called the P-set, are asked to rank-order the statements from their individual point of view, according to some preference, judgement or feeling about them, mostly using a quasinormal distribution. By Q sorting people give their subjective meaning to the statements, and by doing so reveal their subjective viewpoint (Smith 2001) or personal profile (Brouwer 1999). Fig. 10 Laying the Q sort These individual rankings (or viewpoints) are then subject to factor analysis. Stephenson (1935) presented Q methodology as an inversion of conventional factor analysis in the sense that Q correlates persons instead of tests;
“[w]hereas previously a large number of people were given a small number of tests, now we give a small number of people a large number of test-items”. Correlation between personal profiles then indicates similar viewpoints, or segments of subjectivity which exist (Brown 1993). By correlating people, Q factor analysis gives information about similarities and differences in viewpoint on a particular subject. If each individual would have her/his own specific likes and dislikes, Stephenson (1935) argued, their profiles will not correlate; if, however, significant clusters of correlations exist, they could be factorised, described as common viewpoints (or tastes, preferences, dominant accounts, typologies, et cetera), and individuals could be measured with respect to them.
‘Concourse’
Statements forming the Q sort are selected from the so called ‘Concourse’: a collection of perceptions, opinions, expressions and so on associated with a certain topic. In this case: Social Cohesion. The concourse can be collected from:
- Newspapers, magazins, TV, observations, interviews and son on, or constructed from:
- Theory available on the topic. The concourse and the Q sort statements for the SC-Design course have been generated from the three dimensions of Social Cohesion theory, Sense of Belonging, Face to Face contacts, and Social Capital. For each of the three dimensions 8 statements have been formulated (see under).


William Stephenson, inventor of the Q Methodology
Factor Analysis / Theory Outline
For further study material for Factor Analysis theory see references under.
Factor analysis is a statistical method used to describe variability among observed variables in terms of a potentially lower number of unobserved variables called factors. In other words, it is possible, for example, that variations in three or four observed variables mainly reflect the variations in a single unobserved variable, or in a reduced number of unobserved variables. Factor analysis searches for such joint variations in response to unobserved latent The factors resulting from Q analysis thus represent clusters of subjectivity that are operant, i.e., that represent functional rather than merely logical distinctions (Brown 1993; 2002[b]). “Studies using surveys and questionnaires often use categories that the investigator imposes on the responses. Q, on the other hand, determines categories that are
operant” (Smith 2001). A crucial premise of Q is that subjectivity is communicable, because only when subjectivity is communicated, when it is expressed operantly, it can be systematically analysed, just as any other behaviour (Stephenson 1953; 1968).
The results of a Q methodological study can be used to describe a population of viewpoints and not, like in R, a population of people (Risdon et al. 2003). In this way, Q can be very helpful in exploring tastes, preferences, sentiments, motives and goals, the part of personality that is of great influence on behaviour but that often remains largely unexplored. Another considerable difference between Q and R is that “Q does not need large numbers of subjects as does R, for it can reveal a characteristic independently of the distribution of that characteristic relative to other characteristics.
Example_of_Q_factor_analysis_output .txt
References
Exel Job van ,Graaf Gjalt de, 2005 , – Q Methodology/ A sneak PreviewErasmus MC, Institute for Medical Technology Assessment (iMTA),Vrije Universiteit, Dept. of Public Administration & Organisation Science, Faculty of Social Sciences.
Brown Robert, 1996, – Q Methodology and Qualitative ResearchQualitative Health Research,
Campbell, T.C.1995, – Investigating structures underlying relationships when variables are not thefocus: Q – technique and other techniques, paper presented at the Annual Meeting of theAmerican Educational Research Association, San Francisco,
Kramer, B., Hegedus, P., Gravina, V. 2003- Evaluating a Dairy Herd Improvement Project in Uruguayto Test and Explain Q Methodology, Proceedings of the 19th Annual Conference Raleigh, NorthCarolina, USA, , p. 347
Kufeld, C. – A Q –methodological study investigating the identity self – descriptions of a group ofex- smokers, Dissertation Research Project, University of Luton, p. 19
Week 3
Scenario development & Flow Theory / Guest Lecture
A Scenario in SC-Design is the description, visual and/or textual, of a number of events as envisioned to be happening in a certain time frame between actors as a consequence of a new Technology implant.
A Sub Scenario is considered as the envisioning of event(s) to be happening between actors and one or two elements in Setting X .
The Main Scenario is considered as the envisioning of the events that take place between actors, when all Sub Scenarios are assembled into one integral design in Setting X.
1.Scenarios
Scenarios evoke reflection in the content of design work, helping developers coordinate design action and reflection.
Scenarios are at once concrete and flexible, helping developers manage the fluidy of design situations. Scenarios afford multiple views of an interaction, diverse kinds and amounts of detailing, helping developers manage the many consequences entailed by any given design move. Scenarios can also be abstracted and categorized, helping designers to recognize, capture, and reuse generalizations, and to address the challenge that technical knowledge often lags the needs of technical design. Finally, scenarios promote work-oriented communication among stakeholders, helping to make design activities more accessible to the great variety of expertise that can contribute to design, and addressing the
challenge that external constraints designers and clients often distract attention from the needs and concerns of the people who will use the technology.
Elements
Scenarios have characteristic elements. They include or presuppose a setting: Scenarios also include actors: human activities to include several to many actors. Each actor typically has goals or objectives. These are changes that the actor wishes to achieve in the circumstances of the setting. Every scenario involves at least one actor and at least one goal.
Actors
When more than one actor or goal is involved, they may be differentially prominent in the scenario. Often one goal is the defining goal of a scenario, why did this story happen? Similarly, one actor might be the principal actor, the answer to the question who is this story about? Scenarios have a plot; they include sequences of actions and events, things that actors do, things that happen to them, changes in the circumstances of the setting, and so forth.
Events
Particular actions and events can facilitate, obstruct, or be irrelevant to given goals. Representing the use of a system or application with a set of user interaction scenarios makes that use explicit, and in doing so orients design and analysis towards a broader view. It can help designers and analysts to focus attention on the assumptions about people and their tasks that are implicit in systems and applications. Scenario representations can be elaborated as prototypes, through the use of storyboard, video, and rapid prototyping tools. They are the minimal contexts for developing user-oriented design rationale: a given design decision can be evaluated and documented in terms of its specific consequences within
particular scenarios. Scenarios and the elements of scenario-based design rationale can be generalized and abstracted using theories of human activity, enabling the cumulation and development of knowledge attained in the course of design.
2. Flow Theory
(contemplating and envisioning scenarios in ‘Flow State’)
Flow also called “Optimal experience” is a concept developed by Mihaly Csikszentmihalyi.
“the holistic experience that people feel when they act with total involvement” .
References
Csikszentmihayli & Nakamura, Mihaly & Jeanne ,2002, The Concept of Flow, The Handbook of Positive Psychology: Oxford University Press, pp. 89–92, ISBN 9780195135336
Csikszentmihalyi, M.,Optimal experience: psychological studies of flow in consciousness, Cambridge, UK: Cambridge University Press, pp. 15–35,
Csíkszentmihályi, Mihály ,1996, Creativity: Flow and the Psychology of Discovery and Invention, New York: Harper Perennial, ISBN 0-06-092820-4
Csikszentmihalyi, M & Rathunde, K ,1993. “The measurement of flow in everyday life: Towards a theory of emergent motivation”. In Jacobs, JE. Developmental perspectives on motivation. Nebraska symposium on motivation.

Mihaly Csikszentmihalyi / Inventor of Flow Theory

Creativity & Flow theory
Week 4
Philosophy Lecture on Essence of Technology (e.a. Heidegger)

Martin Heidegger

Martin Heidegger / The Question concerning Technology
References
Heidegger Martin,1949, The Question concerning technology, New York, Harper Collins Publishers
Fromm Erich, 1955, The sane society, ISBN 978-0415605861
Fromm Erich,1968, The revolution of hope: towards a humanized technology, ISBN 978- 90561836
Fromm Erich,1976, To have or to be, ISBN 978-0805016048
Papanek Victor,1971, Design for the real world: Human ecology and social change, New York, Pantheon books, ISBN 0-394-47036-2
Papanek Victor,1983, Design for human scale, New York, Van Nostrand Reinhold, ISBN 0-442-276-16-8
Papanek Victor, 1995, The green imperative: natural design for the real world, New York, Thames and Hudson ISBN 0-500-27846-6
Illich Ivan,1973, Tools for conviviality, ISBN 0-06-080308-8

Harris Profile Method
A New Product Profile (or Harris Profile) is a graphic representation of the strenghts and weaknesses of design concepts. Originally, a New Product Profile is applied as a useful tool to evaluate and select development projects (ideas for new business activities).Per design alternative a Harris Profile is created. A number of criteria is used to evaluate the design alternatives. A fourscale scoring is used for all criteria.
Criteria should be selected according to which the design alternatives should be compared (be sure to cover all important aspects of the product development project with the selected criteria). List the criteria and create a four-point scale matrix next to it. The scale is coded-2, -1, +1, and +2. Create a Harris profile for the design alternatives you want to compare. Draw the profile by marking the scores in the four-point scale matrix for all the criteria. When the Harris Progfiles of the design alternatives are completed, the progfiles can be compared and a judgment can be made as to which alternative has the best overall score.

Harris Profile Methodology

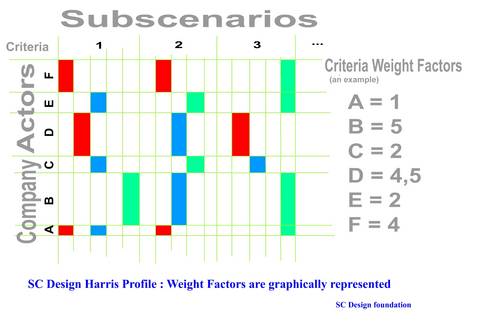
SC Design Harris profile, graphically presenting weight factors
References
Ritchey, T. 2006. “Problem Structuring using Computer-Aided Morphological
Analysis”. Journal of the Operational Research Society (JORS), Vol. 57, No. 7.
Zwicky, F. 1969. Discovery, Invention, Research – Through the Morphological Approach. Toronto: The Macmillian Company.
Zwicky, F. & Wilson A. (eds.) 1967. New Methods of Thought and Procedure: Contributions to the Symposium on Methodologies. Berlin: Springer. Reprint available at
Levin, Mark Sh. 1998. Combinatorial Engineering of Decomposable Systems, Dordrecht: Kluwer Academic Publishers.
Levin, Mark Sh. 2006. Composite Systems Decisions. New York: Springer.
Jones, J.C. 1981. Design Methods. Wiley.
Week 6
Feedback on Concept
Week 7
Business, Branding and Promotion / The ‘Look & Feel’ of a CIPS.
BBP / Theory Outline
For further study material for BBP theory see references .
1.BBP
A business plan
A business plan is a formal statement of a set of business goals, the reasons why they are believed attainable, and the plan for reaching those goals. It may also contain background information about the organization or team attempting to reach those goals. Business plans may also target changes in perception and branding by the customer, client, or larger community. When the existing business is to assume a major change or when planning a new venture a 3 to 5 year business plan
is essential.
A branding plan
Branding describes the process by which entrepreneurs differentiate themselves and stand out from others by identifying and articulating their unique value proposition, and then leveraging it across platforms with a consistent message and image to achieve a specific goal. In this way, enterprises can enhance their recognition as experts in their field, and establish reputation and credibility.
Branding consists of three elements:
- Value Proposition: What does it stand for?
- Differentiation: What makes it stand out?
- Marketability: What makes it compelling?
Promotion plan
Promotion is one of the four elements of marketing mix (product, price, promotion, distribution). It is the communication link between sellers and buyers for the purpose of influencing, informing, or persuading a potential buyer’s purchasing decision. The following are two types of Promotion: Above The Line Promotion: Promotion in the media (e.g. TV , Radio, Newspapers , Internet, Mobile Phones, and, historically, Illustrated songs) in which the advertiser pays an advertising agency to place the ad.
Below The Line Promotion: All other promotion. Much of this is intended to be subtle enough for the consumer to be unaware that promotion is taking place. Examples: sponsorship, product placement, endorsements, sales promotion, merchandising, direct mail, personal selling, public relations,trade shows.
2.The ‘Look & Feel’ of a CIPS.
Humans visually perceive iitems not in isolation, but as part of a larger whole.

Themes:
Defining the ‘The Look and Fee’l of the CIPS in 3D CAD, sketches and storyboards, specifying materials and finishes.
Elaborating on the look and feel of the CIPS to match the Social Mission as developed in stage nr. 1 : 3-i. In other words constructing a message by product design. Good CIPS design should act as a catalyst for ‘Social Change’.
There is general agreement that the way forms are seen follows ‘Gestalt’ rules, these suggest that things are initially seen holistically (as a single object). If this visual form holds attention or is of interest it is then viewed atomistically,iin other words the different elements that make up the form are considered.
Gestalt is a psychology term which means “unified whole”. It refers to theories of visual perception developed by German psychologists in the 1920s. These theories attempt to describe how people tend to organize visual elements into groups or unified wholes when certain principles are applied.
‘Look & Feel’ of the CIPS can help to convey your Social Cohesion Design message.
References
Steffen, Dagmar ,2000, Design als Produktsprache, Der Offenbacher Ansatz in Theorie und Praxis, form Publisher, Frankfurt am Main.
Csikszentmihalyi Mihaly / Rochberg-Halton Eugene,1981, The meaning of things, domestic symbols and the self, University of California Pres
Arnheim, Rudolf , 1969: Visual Thinking, Berkeley, California, University of California Pres
Rheinfrank, J., & Evenson, S. ,1996. Design Languages. In T. Winograd (Ed.), Bringing design to software (pp. 63-80). New York: Addison-Wesley (ACM Press).
Week 8
Likert Scale Methodology
Likert Scale Methodology / Theory Main Line
A likert Scale is a psychometric scale commonly used in questionaires, and is the most widely used scale in survey research, such that the term is often used intercangeably with rating scale even though the two are not synonymous. When responding to a Likert questionaire item, respondents specify their level of agreement to a statement. The scale is named after its inventor, psychologist
Rensis Likert.
An important distinction must be made between a Likert Scale and a Likert Item. The Likert scale is the sum of responses on several Likert items. Because Likert items are often accompanied by a visual analog scale, the items are called sometimes scales themselves. A Likert item is simply a statement which the respondent is asked to evaluate according to any kind of subjective criteria; generally the level of agreement or disagreement is measured. Often five ordered response levels are used, although many psychometricians advocate using seven or nine levels; The format of
typical five-level Likert item is:
- Strongly disagree
- Disagree
- Neither agree nor disagree
- Agree
- Strongly agree
After the questionaire is completed, each item can be analyzed separately or in some cases item responses yam be summed to create a score for a group of items. Hence, Likert scales are often called summative scales.

Likert Scale Methodology
References
Wuensch, Karl L. , 2005. “What is a Likert Scale? and How Do You Pronounce ‘Likert?'”. East Carolina University.
Likert, Rensis ,1932, “A Technique for the Measurement of Attitudes”. Archives of Psychology 140: 1–55.
Mogey, Nora ,1999, “So You Want to Use a Likert Scale?”. Learning Technology Dissemination Initiative. Heriot-Watt University.
Babbie, Earl R. ,2005, The Basics of Social Research. Belmont, CA: Thomson Wadsworth. p. 174. ISBN 0534630367.
Trochim, William M. ,2006. “Likert Scaling”. Research Methods Knowledge Base, 2nd Edition..
Meyers, Lawrence S.; Anthony Guarino, Glenn Gamst ,2005. Applied Multivariate Research: Design and Interpretation. Sage Publications. p. 20. ISBN 1412904129.
Week 9
Course Evaluation & Preparation for “Wise Owl” Award presentations.